# How to Read and Interpret Summaries and Reports
### Report Overview
Each report is divided into several key sections:
* **Report Details & Client Information:**\
This section provides contextual data about the session, including the date, the creator (or organization), and client specifics such as name, age, gender, weight, and height.
* **Summary & Feedback:**\
At the top, you’ll find an expandable feedback window containing general observations. For example, it might note, “Great consistency in jump height, but work on reducing landing impact.” This feedback is generated by our Gen AI based on your performance metrics.
* **Performance Metrics:**\
Detailed numerical and graphical representations of your key metrics are provided. Depending on the activity, these may include:
* **Running:** Speed, Pace, Cadence, Mechanical Running Power, Ground Contact Time, Flight Time, Contact Angle, Foot Strike, Stride Length, and more.
* **Jumping:** Ground Reaction Force, Reactive Strength Index, Jump Height, Flight Time, COM Velocity at Takeoff, and others.
* **Weightlifting:** Max Bar Speed, Max GRF, Max Power, Total Time, Bar Acceleration, Catch Time, etc.
* **Walking:** Speed, Pace, Cadence, Contact Time, Stride Length, Stride Time, Contact Angle, Foot Strike, Ground Reaction Forces, Balance (L/R symmetry), Normalized Power, Incline, Pelvis Oscillation, CoM Motion, Knee Flexion, Shank Angle at Initial Contact, Upper & Lower Trunk ROM, and more.
* **Mobility Assessment:** Squat Depth, Hip Range of Motion, Trunk Angle, Knee Symmetry, Hip Symmetry, Pelvic Tilt (Butt Wink), Descent Time, Ascent Time, Movement Smoothness, Velocity Profile, Tempo Consistency, Rep Completeness, Depth Consistency, and Symmetry Stability.
* **Workspace Wellness (Ergonomics):** Cranio-Vertebral Angle (Head Posture), Elbow Angle, Wrist Dorsiflexion & Ulnar Deviation, Thoracic Kyphosis, Lumbar Lordosis, Pelvic Tilt, Desk–Elbow Delta, Screen–Eye Delta, along with reference measurements like Standing Height, Camera Distance, Camera Height, Desk Height, and Screen Height.
* **Recommendations:**\
Based on the performance data, the report includes specific recommendations to help you optimize your training. These suggestions are tailored to highlight areas for improvement and to benchmark your progress against ideal performance ranges.
* **Visual Charts & Comparisons:**\
Charts and graphs illustrate your performance trends over time and compare your metrics to normative values or previous sessions. These visuals help you quickly spot patterns and identify areas where you’re excelling or need improvement.
***
### How to Use Your Report
1. **Review Client and Session Details:**\
Start by checking the session date, client information, and the creator details. This context is important for tracking progress over multiple sessions.
2. **Read the Summary:**\
The expandable feedback window gives you a quick, high-level view of your performance. Use this as a starting point to dive deeper into specific metrics.
3. **Examine Performance Metrics:**\
Look at the numerical values and graphs for each metric. For example, in a running report, note your average speed, cadence, and power. Compare these values with the recommended ranges provided in our documentation.
* In **Running Reports**, notice how metrics such as ground contact time and stride length relate to overall efficiency.
* In **Jumping Reports**, focus on jump height, flight time, and force production to gauge your explosive power.
* In **Weightlifting Reports**, assess bar speed, GRF, and power output to understand your lift dynamics.
* **In Walking Reports**, focus on how cadence, stride length, contact time, and balance symmetry relate to walking efficiency. Check patterns such as overstriding, excessive contact time, or asymmetry that may indicate fatigue, compensatory movement, or risk of discomfort.
* **In Mobility Assessment Reports**, examine depth, hip/knee angles, symmetry, and movement smoothness across repetitions. These metrics help you identify mobility restrictions, compensations, or stability challenges that influence squatting and general lower-body mechanics.
* **In Workspace Wellness Reports**, evaluate posture angles such as head position (CVA), shoulder–elbow alignment, wrist angles, and spinal curvature. Compare desk, elbow, and screen height relationships to recommended ergonomic standards to identify potential sources of strain or poor workstation setup.
4. **Analyze Visual Comparisons:**\
Use the charts to compare your current session against previous sessions or against ideal performance benchmarks. This helps identify trends in your performance over time.
5. **Read the Recommendations:**\
Our system provides tailored recommendations based on your data. Follow these suggestions to adjust your training or technique—for example, improving cadence in running or optimizing the takeoff phase in jumping.
### Jumping reports
**The countermovement jump (CMJ)** is a widely used method to assess lower-body explosive power in sports performance. It’s a dynamic movement involving both an eccentric (stretch) phase and a concentric (shortening) phase, providing key insights into an athlete's physical capabilities and areas for improvement.
### What Makes the CMJ Valuable?
The CMJ offers more than just a measure of how high an athlete can jump. It provides detailed performance metrics and descriptive indicators, revealing the "how" behind the result. For instance, it helps answer questions like:\
\
⏺︎ **Was the athlete quick off the ground?**\
⏺︎ **Are they powerful but lack speed?**\
⏺︎ **Did they perform a shallow or deep jump?**\
\
By examining both the outcome (jump height) and the movement patterns, coaches can gain a comprehensive understanding of an athlete’s strengths and weaknesses.
#### Application Across Sports
From basketball to rugby, volleyball to sprinting, the CMJ is a reliable and practical tool for monitoring performance and tracking progress. Even sports without a major vertical component benefit from CMJ assessments because vertical force is the foundation of all human movement—even in sprinting, where vertical force drives forward momentum.
### Body Weight Phase
The Body Weight phase, often called the weighing or stance phase, marks the start of the CMJ. During this phase, the athlete stands still for at least one second, ensuring accurate measurement of their body weight in Newtons. This silent period is critical as it establishes a baseline before movement begins, reflected as a stable force level on the force-time curve.
#### Relevance in Sports and AiKYNETIX Analysis
On the [AiKYNETIX Web Platform](https://aikynetix.app/login), the Body Weight phase provides key data for monitoring an athlete’s weight trends over time. The Report feature displays fluctuations, helping coaches and athletes assess weight stability and its potential impact on performance. The graphic below demonstrates the ground reaction forces (GRF) during this phase for four consecutive jumps. Variations between colored lines (blue, orange, green, red) may highlight subtle differences in balance or posture across attempts.
This initial phase is essential for ensuring valid and reliable CMJ analysis, making it a foundational step in assessing athletic performance.
***
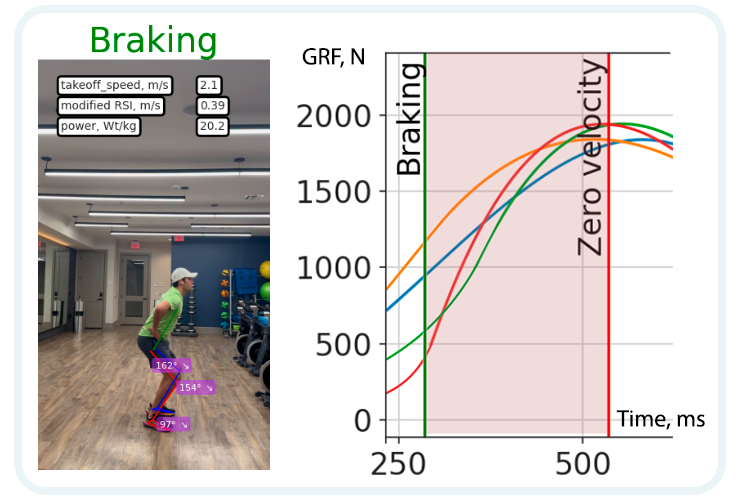
### Braking Phase
The braking phase marks the start of active movement in the CMJ. During this stage, the athlete initiates a countermovement by relaxing key muscles, allowing for flexion at the hips and knees, along with some dorsiflexion at the ankles. This phase begins when the measured force drops below the athlete’s body weight, signifying a moment of free-fall as the body descends. Negative velocity characterizes this phase, as the athlete continues to accelerate downward. The graphic below highlights where the breaking phase occurs on the force-time curve.\
#### Why It Matters in Sports Performance
The braking phase is crucial for setting up the subsequent stages of the CMJ. Efficient braking allows athletes to better prepare for the transition into the zero-velocity and push-off phases, ultimately improving overall jump performance. In fact, the energy absorbed during braking directly impacts the energy generated in the following phases, as seen in the equivalence of their force-time curve areas.\
\
Athletes who struggle with this phase often show reduced efficiency in their movements, which can limit explosive power and overall jump height. By analyzing the braking phase, coaches and athletes can identify areas for improvement and optimize movement patterns for better results.
***
### Zero Velocity Phase
The zero-velocity phase of the CMJ is a critical moment when the athlete decelerates their center of mass (COM) as it transitions upward. This phase begins immediately after the braking phase when force applied by the athlete returns to system weight, and COM velocity shifts from its peak negative value to zero. Despite the term "zero-velocity," the athlete is still moving downward during this phase, reaching the lowest point of the countermovement. The graphic below highlights where the zero-velocity phase occurs on the force- time Curve.\
#### Importance in Athletic Performance
This phase reveals how effectively an athlete can decelerate their body, reflecting the ability to control eccentric muscle actions. It can also indicate overall movement efficiency, as challenges in this phase may suggest areas for improvement in strength, control, or coordination.\
Practitioners can use insights from the zero-velocity phase to identify weaknesses and design targeted exercises, such as eccentric training or plyometrics, to optimize performance. Understanding this phase is key to refining movement patterns for greater explosiveness in athletic activities.
***
### Push-Off Phase
The push-off phase, often called the concentric or propulsion phase, is when the athlete generates maximum upward force to extend their hips, knees, and ankles, propelling their center of mass (COM) vertically. This phase begins as soon as the COM velocity becomes positive, marking the transition from deceleration to upward momentum. It represents the explosive effort that powers the jump. The graphic below highlights where the push-off phase occurs on the force- time Curve.
#### Importance in Athletic Performance
This phase is a critical measure of an athlete's ability to generate force and power effectively. Key metrics analyzed during the push-off phase include average or peak relative propulsive force and power.
> **Efficiently transitioning from the zero-velocity phase to push-off demonstrates an athlete's ability to convert stored energy into upward momentum.**
For athletes struggling in this phase, training programs may include specific exercises like **Cleans**, **Trap Bar Jumps**, or **Pin Squats** to improve propulsive power. By optimizing performance in the push-off phase, athletes can maximize jump efficiency and achieve better overall results in power-based movements.
***
### Flight Phase
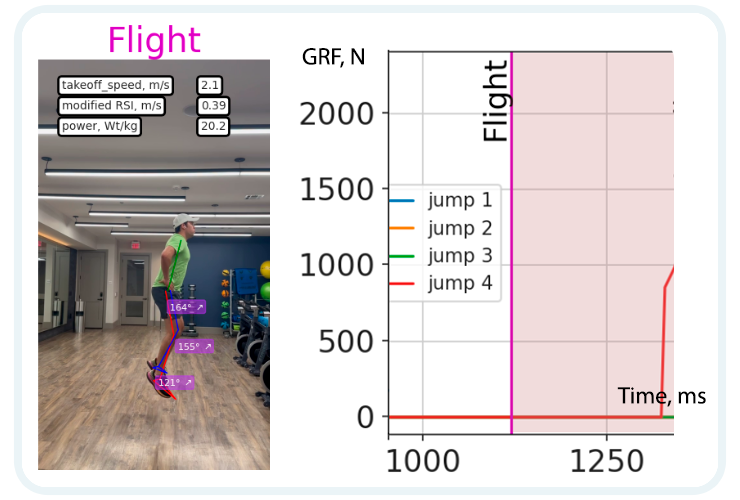
The flight phase in a countermovement jump (CMJ) starts the moment the athlete's feet leave the ground. This phase represents the peak of the athlete’s effort, aiming to achieve the maximum vertical displacement of the center of mass (COM) before gravity brings them back down.\
\
Defined as the interval between take-off (when ground reaction force drops below a threshold) and landing (when the athlete reconnects with the ground and force exceeds the threshold again), the flight phase is straightforward yet crucial. During this time, no external forces other than gravity act on the athlete. The graphic below highlights where the flight phase occurs on the force- time Curve.
#### Why Is It Important in Sports?
The flight phase is the culmination of all prior phases—braking, deceleration, and propulsion. It reveals how effectively the athlete generates and transfers momentum into the air. Measuring the duration of the flight phase and the corresponding jump height can provide valuable insight into an athlete’s explosive power and performance in sports requiring vertical jumps. For coaches and athletes, monitoring trends in flight time can track improvements in strength and power output.
***
### Landing, Damping, and Stabilization Phases: Managing the End of a Jump
The final stages of the countermovement jump (CMJ) involve three critical phases: **Landing**, **Damping**, and **Stabilization**. These phases ensure the athlete safely transitions back to the ground and regains control after the jump.
#### Landing Phase
The landing phase begins the moment the athlete makes contact with the ground after the flight phase. During this time, the athlete absorbs the impact force and applies a net impulse equal to the propulsion impulse, decelerating the center of mass (COM) from its downward velocity to zero. The height of the jump determines the landing velocity, with higher jumps leading to more significant impact forces. This phase ends when the COM velocity stabilizes at zero.
#### Damping Phase
Following the landing, the damping phase is where the athlete actively controls and absorbs the residual forces from impact. This phase is crucial for managing joint and muscle loads to prevent injury. The athlete works to stabilize their body by engaging muscles to dissipate the energy from landing. It’s a transitional phase where control and efficiency play a significant role in minimizing the risk of overloading the lower limbs.
#### Stabilization Phase
Finally, the stabilization phase marks the athlete’s return to a balanced, steady posture. This phase is characterized by the athlete’s ability to remain still and maintain control over their body. It ends when all forces return to baseline levels, reflecting full recovery from the dynamic movement. Stabilization highlights an athlete’s balance and readiness to transition into the next movement. The graphic below highlights where those phases occur on the force- time Curve.
#### Application in Sports
These phases are vital for performance and injury prevention across various sports. Monitoring landing mechanics can reveal discrepancies in how each limb absorbs force, offering insights into potential asymmetries or imbalances. Damping efficiency shows how well an athlete controls impact forces, while stabilization assesses balance and readiness for subsequent movements. Together, these phases help evaluate an athlete’s overall biomechanics, balance, and injury risk.
***
### A Comprehensive Approach to Assessing the Countermovement Jump
When evaluating athletic performance through a **Countermovement Jump (CMJ)**, Jump Height often takes center stage. While valuable, focusing solely on this metric limits the depth of insights available. Historically, Jump Height became the primary benchmark because early tools like Vertec devices, jump mats, and even simple wall-and-chalk methods only provided basic data. However, these options often inflated results and failed to capture the full biomechanical picture.\
\
Modern force plates revolutionized CMJ analysis by offering a detailed look at the process, not just the outcome. Jump Height represents the vertical displacement of an athlete's center of mass (COM), but it’s merely the result of a complex chain of events. Every phase—from braking to flight—plays a crucial role in determining performance. Metrics like Reactive Strength Index and COM velocity at takeoff now offer deeper insights into an athlete’s ability to apply force effectively and transfer momentum efficiently.
***
### Vertical Jump Testing Guide
#### Selecting the Right Metrics for Vertical Jump Testing
Vertical jump testing is an essential tool for understanding athletic performance, monitoring fatigue, and guiding rehabilitation. It provides valuable insights into how athletes produce force, transfer momentum, and adapt to training or recovery demands. While jump height is the most commonly sought metric, a comprehensive analysis of vertical jump performance requires considering a range of metrics that reveal both outcomes and the strategies used to achieve them.
#### Matching Metrics to Goals
The ultimate objective of a vertical jump is simple: achieve maximum height. However, the method by which an athlete achieves this height—referred to as jump strategy—offers critical information about their movement efficiency, strength, and neuromuscular readiness. Metrics like **Reactive Strength Index (RSI)**, **MGRF at takeoff**, and **Takeoff Velocity** allow practitioners to assess these underlying factors.\
\
While traditional tools such as force plates and jump mats provide basic data like jump height and flight time, they fail to capture the nuances of how force is applied throughout each phase of the jump. Modern platforms enable a deeper dive, offering metrics like **Countermovement Depth**, **Phase-Specific Impulse**, and **Ground Reaction Force at Takeoff**. These advanced metrics paint a fuller picture of an athlete’s performance and adaptability.
\
\
For instance, monitoring the **Braking Phase Impulse** helps identify how efficiently an athlete decelerates their center of mass before initiating the upward motion. Similarly, the **Push-Off Duration** highlights how well they generate propulsive force to maximize height. By focusing on these metrics, practitioners can tailor training to target specific weaknesses and enhance overall performance.
#### Athlete Monitoring with Vertical Jump Testing
Regular vertical jump testing provides a standardized and repeatable method for tracking an athlete’s response to training. By monitoring trends in key metrics, practitioners can assess fatigue levels, neuromuscular readiness, and the effectiveness of training plans.\
\
Jump testing can be integrated into various stages of an athlete’s training cycle. For example:\
\
⏺︎ **After Rest Days:** Testing can provide a baseline measure of recovery and readiness.\
⏺︎ **Before and After Workouts:** These tests help evaluate acute fatigue responses to specific training loads.\
⏺︎ **End of Micro cycles:** Testing at this stage can measure accumulated fatigue and inform recovery plans.
\
Metrics such as **Takeoff Velocity**, **Jump Contraction Time**, and **RSI** are particularly useful for gauging an athlete’s readiness and reaction to training stimuli. By correlating jump data with training loads and perceived exertion, coaches gain a holistic view of an athlete’s performance trajectory.
#### Jump Strategy Analysis
An athlete’s jump strategy can adapt in response to fatigue, training, or injury. Tracking metrics like Countermovement Depth and Eccentric Deceleration Impulse over time reveals how movement patterns evolve. While some changes are visible, such as shallower countermovement depth or slower jump execution, others require detailed analysis of force-time curves.\
\
Repeated testing allows practitioners to detect subtle shifts in strategy that might indicate compensations or inefficiencies. These insights help refine training plans and address potential injury risks before they become significant.
#### Strength Testing with Vertical Jumps
Vertical jumps are not only useful for monitoring performance but also for assessing muscle strength and endurance. Tests like Loaded CMJ and Repeated Jumps offer insights into specific capacities:\
\
·**Loaded Jumps:** Adding external weight helps evaluate high-force production and eccentric deceleration capabilities. Metrics like Velocity-Load Profiles and Force at Peak Power are particularly informative.\
·**Repeated Jumps:** These assess power endurance by analyzing performance over multiple cycles.
\
Unilateral and bilateral variations of these tests provide a comprehensive assessment of lower limb strength and symmetry. Familiarizing athletes with these protocols during regular training sessions improves test reliability and execution.
#### Supporting Recovery and Rehabilitation
For athletes returning from injury, vertical jump testing is invaluable for assessing readiness and progress. Unilateral and bilateral tests measure asymmetries and track recovery milestones. Metrics like Left vs. Right Impulse, Asymmetry Index, Hip height, Hip Speed, Power, Knee Angle, Ankle Angle and Hip Angle provide detailed data on how well an athlete is regaining strength and coordination.By examining hip height and speed during jumps, we can evaluate how effectively each leg applies force. Unequal hip height or speed may reveal differences in force production between the left and right limbs, leading to impulse asymmetry. Variations in hip movement patterns can also indicate imbalances. Additionally, discrepancies in joint angles during the braking or push-off phases may suggest unequal force generation; for instance, a smaller knee or hip angle on one side could indicate reduced force output, contributing to overall imbalance. Observing variability in joint angles can serve as a clear sign of asymmetry and may reflect compensation strategies to address these imbalances.
\
Using a battery of tests, practitioners can establish benchmarks for each phase of recovery and communicate these milestones to the athlete and support team. Vertical jump testing serves as a guide for designing effective rehabilitation programs and ensuring safe returns to sport.
#### Why Vertical Jump Testing Matters
Vertical jump testing offers more than just a measure of athletic ability; it provides a comprehensive framework for understanding performance, fatigue, and recovery. By leveraging advanced metrics and repeated testing, coaches and practitioners can make data-driven decisions that optimize training outcomes and reduce injury risks.
---
# Agent Instructions: Querying This Documentation
If you need additional information that is not directly available in this page, you can query the documentation dynamically by asking a question.
Perform an HTTP GET request on the current page URL with the `ask` query parameter:
```
GET https://docs.aikynetix.app/aikynetix-support/how-to-read-and-interpret-summaries-and-reports.md?ask=
```
The question should be specific, self-contained, and written in natural language.
The response will contain a direct answer to the question and relevant excerpts and sources from the documentation.
Use this mechanism when the answer is not explicitly present in the current page, you need clarification or additional context, or you want to retrieve related documentation sections.